Written Commentary

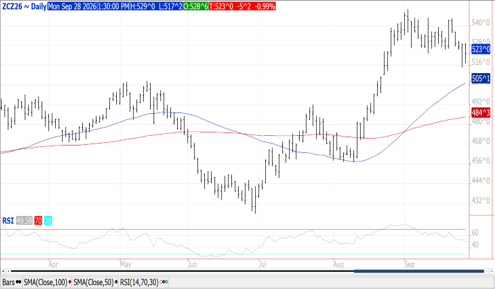
Prices were $.03-$.05 lower, closing near the midpoint of the session’s range while spreads were little changed. Dec-26 futures held within Friday’s range. While prospects for US sales to China is encouraging, weaker soybean prices and favorable harvest conditions for most of the Midwest weighed on prices. Despite money managers selling just over 12k contracts last week, they still hold near record length in corn. The Reuters survey shows analysts expect Sept. 1st US corn stocks at 1.918 bil. bu. vs. 1.551 bil. YA and down slightly the USDA Sept-26 WASDE estimate of 1.922 bil. Export inspections at 62 mil. bu. were in line with expectations and amount needed per week to reach the USDA export forecast. YTD inspections at 225 mil. are up 12% from YA, vs. the USDA forecast of down 4.6%. Noted buyers were Mexico – 20 mil., Korea – 13 mil. While Japan took 10 mil. AgRural places Brazil’s 1st crop plantings at 34% vs. 32% YA. MARS, the EU crop monitor, once again lowered their 2026 corn yield to 6.5 mt/HA, down from 6.61 mt/HA the previous month.
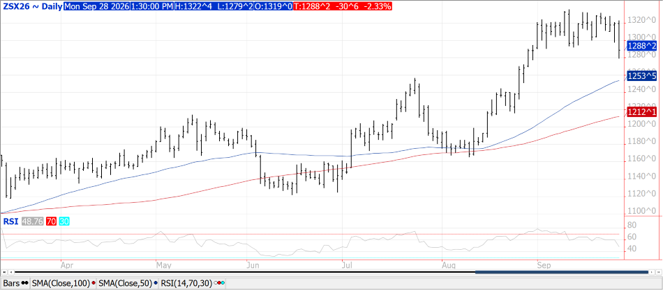
Prices were sharply lower across the complex, however did manage to bounce off session lows. Beans were down $.24-$.30, meal was off $8-$12 while oil was down 20-30 points. Bean and meal spreads weakened while oil spreads were mixed. Nov-26 beans plunged to new lows for the month. Under the negotiated US-China Board of Trade agreement, reduced reciprocal tariffs will lower the cost of $60 bil. worth of goods imported between the world’s 2 largest economies. While this will allow China to import US feed grains, meat, dairy and soybean products at reduced tariffs, the list didn’t include soybeans which seems to be the biggest take away from yesterday’s announcement. This will continue to limit China’s purchase of US soybeans to Govt. controlled entities COFCO and Sinograin. There was some built in hope that by eliminating extra tariffs on US soybeans, total US sales to China would exceed the 25 mmt agreement. Sinograin auctioned off only 192k mt of soybeans from state reserves, 37% of the volume offered. Friday’s CFTC data showed MM’s were net buyers of 20k contracts of soybeans, extending their long position to 265k, within 1k of their record long from 2 weeks ago. MM’s also bought nearly 7k contracts of soybean meal, extending their record long positions to 192k. They also extended their record net long position across the soybean complex by nearly 13k to 554k. Healthy selling today likely lowering that figure to around 525k. The Reuters survey shows traders expect Sept. 1st US bean stocks at 324 mil. bu. vs. 325 mil. YA which was also the USDA Sept-26 WASDE estimate for 25/26 ending stocks.
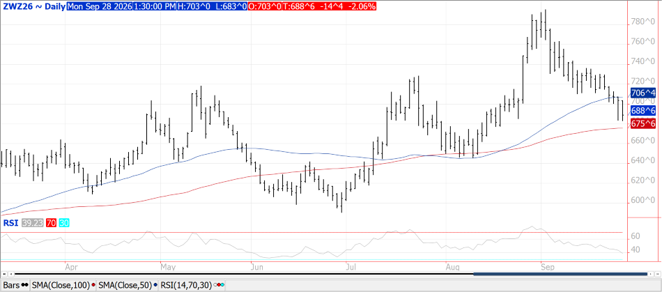
Prices ranged from $.12-$.16 lower. CGO Dec-26 was down $.14 ½ at $6.88 ¾ while holding between its 50 and 100-day MA’s. Dec-26 KC was off $.16 ¼ at $7.45 ¾, also holding between key MA’s. Dec-26 MIAX was down $.11 ¾ at $7.01 ¾ falling to a 6-week low. Turkey submitted a proposal to Russia late last week to allow Black Sea shipments however so far no peace talks are being considered. Russia claimed to have struck 2 bulk vessels and data centers in Kyiv overnight. A Reuter’s report states that 80% of Russia’s Black Sea grain export terminals could be operational once a peace agreement is reached having not sustained significant damage. IKAR reports Russia’s wheat export price ended last week at $267/mt FOB, down $1 from the previous week. The lowest offer for Pakistan’s 185k mt tender was $339.36/mt CF with no sale yet announced. The Reuters survey shows traders expect all US wheat production at 1.524 bil. bu., down from 1.531 bil. in Aug-26. Sept. 1st stocks are expected at 1.872 bil., well below the 2.134 bil. YA. Export inspections at 11 mil. bu. were in line with expectations, however, below the 14 mil. needed per week to reach the USDA export forecast. YTD inspections at 233 mil. bu. is down 34% from YA vs. the USDA forecast of down 15%.
Risk Warning: Investments in Equities, Contracts for Difference (CFDs) in any instrument, Futures, Options, Derivatives and Foreign Exchange can fluctuate in value. Investors should therefore be aware that they may not realise the initial amount invested and may incur additional liabilities. These investments may be subject to above average financial risk of loss. Investors should consider their financial circumstances, investment experience and if it is appropriate to invest. If necessary, seek independent financial advice.
ADM Investor Services International Limited, registered in England No. 2547805, is authorised and regulated by the Financial Conduct Authority [FRN 148474] and is a member of the London Stock Exchange. Registered office: 3rd Floor, The Minster Building, 21 Mincing Lane, London EC3R 7AG.
A subsidiary of Archer Daniels Midland Company.
© 2021 ADM Investor Services International Limited.
Futures and options trading involve significant risk of loss and may not be suitable for everyone. Therefore, carefully consider whether such trading is suitable for you in light of your financial condition. The information and comments contained herein is provided by ADMIS and in no way should be construed to be information provided by ADM. The author of this report did not have a financial interest in any of the contracts discussed in this report at the time the report was prepared. The information provided is designed to assist in your analysis and evaluation of the futures and options markets. However, any decisions you may make to buy, sell or hold a futures or options position on such research are entirely your own and not in any way deemed to be endorsed by or attributed to ADMIS. Copyright ADM Investor Services, Inc.