Written Commentary

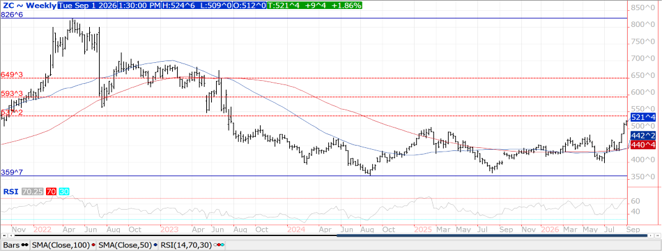
Prices were $.07-$.09 higher in volatile 2-sided trade. Dec-26 futures carved out a new contract high for a 3rd consecutive session. Next resistance for the spot contract is $5.38, a 38% retracement on the weekly chart. O.I. increased 15.5k contracts in yesterday’s trade. Corn ratings held steady at 57% G/E, however there was a 1% shift from excellent to good. Composite ratings improved in 5 states, declined in 10, while holding steady in 3. Conditions fell to a new low for the growing season while holding below the historical average. The USDA will begin providing harvest updates next week. Expectations for lower EU and US production with prospects for higher usage (potentially China) tighten the global stocks outlook. EU 2026/27 imports as of Aug. 30th at 3.16 mmt are up 41% YOY. Corn usage for ethanol production in July-26 reached 475 mil. bu. up 3.7% YOY. Through 11 months in the 25/26 MY, corn usage has reached 5.068 bil. bu., up 1.8% from YA, vs. the USDA forecast of up 2.1%. To reach the USDA forecast of 5.550 bil. bu. usage in Aug-26 needs to reach 482 mil. bu. vs. 463 mil. YA. Best guess the USDA forecast is 5-10 mil. bu. too high.
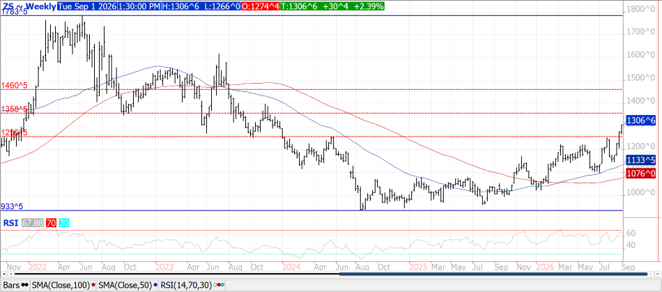
Prices surged higher across the complex with beans up $.25-$.30, meal was $5-$7 higher while soybean oil is up just over $.01 ½ lb. Bean and oil spreads firmed while meal spreads were mixed. Nov-26 surged above $13 for the first time while trading to new contract high for a 5th consecutive session. Next resistance for the spot soybean contract is $13.60, a 50% retracement on the weekly chart. Oct-26 meal traded to a 2-year high. Oct-26 oil gapped higher while filling a chart gap from late July. Next resistance is the July high at 74.52. Soybean oil was the overnight leader jumping out to a 6-week high after the EPA announced SRE’s for 2025 totaling 1.76 bil. RIN’s would be fully reallocated to larger refineries in future years. The USDA announced another flash sale of 136k mt (5 mil. bu.) of soybeans to China. Crush margins were up $.05 at $2.41 ½ bu. with bean oil PV recovering to 51.4%. D4 RIN values surged more than 20% to over $2.32, up from their August low just under $1.80. Crop ratings fell 2% to 58% G/E, in line with expectations. Composite ratings fell to the lowest of the crop cycle while holding just below the historical average. 13% of the crop is dropping leaves vs. 10% from YA and 5-year Ave. of 9%. The MM combined long position in the soy complex is likely challenging the all-time high of 502k contracts from this past May. Poor US finishing weather combined with Chinese buying provide little wiggle room for US yields to slip from the current USDA forecast of 52.7 bpa. Census crush in July-26 at 222 mil. bu. was slightly above expectations while bringing YTD crush to 2.436 mil. bu. To reach the USDA forecast of 2.655 bil., crush in Aug-26 will need to reach 219 mil. bu. vs. only 198 mil. YA. Bean oil stocks slipped to 1.963 bil. lbs. vs. expectations of 1.878 bil.
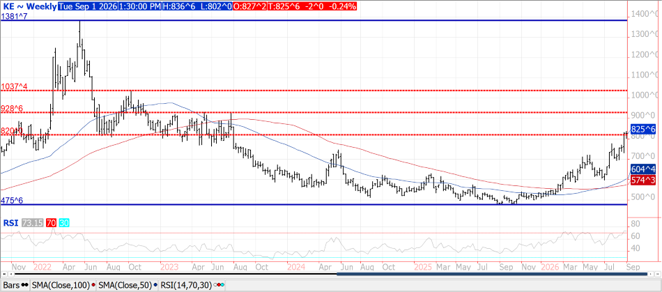
Prices ranged from $.07 to $.14 higher. CGO Dec-26 was up $.08 ½ at $7.82 ½, KC Dec-26 was $.07 ¼ higher at $8.45 ¼ while Dec-26 MIAX was $.13 ¾ higher at $7.76 ¾. Recent rains enabled ABARES raised their 2026/27 Australian wheat production forecast 3 mmt to 29.9 mmt, still 17% below last year’s harvest however. The USDA is forecasting 2026/27 production at 28 mmt. Kazakhstan wheat exports in 2025/26 are expected to have jumped 16% YOY to 8.3 mmt as more Russian wheat has flowed thru their country. Russia has shifted requests for up to 5 mmt of wheat exports thru the Baltic Sea, up from only 1 mmt last year and 2.5 mmt 2 years ago. Ukraine has harvested 32 mmt of grain so far, or 58% of the planted area. Just over 5 mil. HA of wheat has been harvested with volume reaching 24.76 mmt producing an average yield of 4.92 mt/per HA. The backlog of vessels looking to transit thru Ukraine’s Danube River to ports in Izmail and Reni has swelled to 80. US spring harvest advanced 15% to 77% complete, above expectations and above the 69% pace from YA and the 5-year Ave. of 68%. EU soft wheat exports as of Aug. 30th at 4.16 mmt is down 3.7% YOY. Jordan made no purchase in today’s 120k mt wheat tender.
Risk Warning: Investments in Equities, Contracts for Difference (CFDs) in any instrument, Futures, Options, Derivatives and Foreign Exchange can fluctuate in value. Investors should therefore be aware that they may not realise the initial amount invested and may incur additional liabilities. These investments may be subject to above average financial risk of loss. Investors should consider their financial circumstances, investment experience and if it is appropriate to invest. If necessary, seek independent financial advice.
ADM Investor Services International Limited, registered in England No. 2547805, is authorised and regulated by the Financial Conduct Authority [FRN 148474] and is a member of the London Stock Exchange. Registered office: 3rd Floor, The Minster Building, 21 Mincing Lane, London EC3R 7AG.
A subsidiary of Archer Daniels Midland Company.
© 2021 ADM Investor Services International Limited.
Futures and options trading involve significant risk of loss and may not be suitable for everyone. Therefore, carefully consider whether such trading is suitable for you in light of your financial condition. The information and comments contained herein is provided by ADMIS and in no way should be construed to be information provided by ADM. The author of this report did not have a financial interest in any of the contracts discussed in this report at the time the report was prepared. The information provided is designed to assist in your analysis and evaluation of the futures and options markets. However, any decisions you may make to buy, sell or hold a futures or options position on such research are entirely your own and not in any way deemed to be endorsed by or attributed to ADMIS. Copyright ADM Investor Services, Inc.