MONTHLY COMMODITIES MARKET OVERVIEW
>>Read the complete, in-depth May 2026 Edition HERE
KEY HIGHLIGHTS
CORN
- May WASDE US 2025/26 ending stocks 2.142 billion bushels, +15 million from April and slightly above expectations.
- 2025/26 Argentine production +7 million metric tons to 59 million, and Brazil was +3 million tons to 135 million.
- 2025/26 world ending stocks were up only 2 million metric tons to 297 million.
- US 2026 production 15.995 billion bushels, -126 million from 2025 and in line with expectations.
SOYBEANS
- May WASDE US 2025/26 ending stocks 340 million bushels, -10 million from April, with crush +20 million and exports -10 million.
- Higher domestic usage and exports offset higher meal supplies from the increased crush.
- Domestic oil usage rose 330 million pounds (+200 million for biofuel), largely offsetting higher supplies from the higher crush.
- US 2026 production at 4.435 billion bushels,+173 million from 2025, with trendline yields holding at 53 bushels per acre.
WHEAT
- US 2025/26 ending stocks 935 million bushels, -3 million from April and in line with expectations.
- World 2025/26 ending stocks 279.2 million metric tons, -4 million from April and well below expectations.
- US 2026 all wheat production 1.561 billion bushels, -424 million from 2025 and 174 million below expectations.
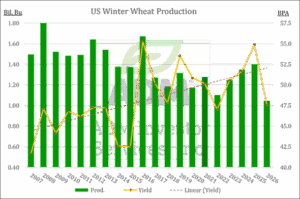
- US 2026 winter wheat production 1.048 billion bushels, -354 million from 2025 and 151 million below expectations.
COCOA
- Bloomberg reported in May that Ivory Coast has raised its production forecast to 2.0-2.2 million metric tons, up from 1.8-1.9 previously, citing people familiar with the matter. Good growing weather was credited for the increase. This may have come as a shock to traders who were expecting revisions lower in future months because of El Niño.
- The US Climate Prediction Center has given El Niño an 82% chance of arriving in May-July and a 96% chance for it to last into in December 2026-February 2027. World Weather Inc. points out that the quick onset will not necessarily translate into a quick change in climatic conditions; that could still take months. Impacts likely to the be greatest from late 3rd quarter though the first half of 2027.
- Indonesia would be one of the first areas hit; they are sixth largest producer in the world. Late in the 3rd quarter, dry conditions could hinder late-developing pod size and quality.
COFFEE
- The arabica harvest in Brazil is just getting underway, and it is expected to be quite large. This is the “on-year” in the crop’s biennial cycle, and growing conditions were viewed as favorable for a strong crop. A note from Rabobank suggested that it was “just a matter of time” before the coffee market transitions into a large surplus and lower prices.
- Safras & Mercado said in mid-May that Brazilian coffee producers had sold 86% of their 2025/26 crop as of mid-April, down from 96% a year earlier and a five year average of 94% for this point in the year. New crop (2026/27) sales were 16% of expected production. Harvest progress was 6% versus 7% a year earlier.
- In late April, the Coffee Trading Academy raised its forecast for Brazil’s 2026/27 coffee crop to 71.4 million bags, a new record and an increase of 11.5% from 2025/26.
SUGAR
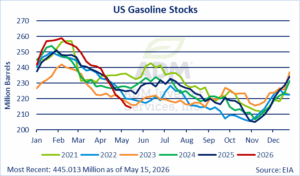
- UNICA data showed Brazil center-south cane crush for the first half of April was 19.956 million metric tons, up from 16.676 million a year prior. However, sugar production totaled was 647,000 metric tons during period, down from 735,000 a year ago because sugar’s share of the crush was just 32.9% versus 44.7% for the same period last year. Higher oil and gasoline prices are encouraging processors to crush more cane for ethanol production at the expense of sugar.
- For the second half of April a survey of analysts conducted by S&P Global called for sugar production be higher than a year ago because conditions during the period are believed to have been ideal for harvest and crush, bringing in higher sugar production even if the ethanol share remains high.
COTTON
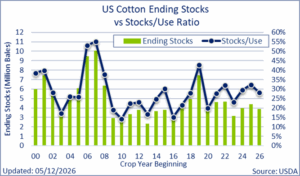
- The market sold off on disappointment when the Trump/Xi meetings concluded with no announcement that China was committing to buy US agricultural products, and then the selling was compounded by the arrival of timely rains in the US cotton belt.
- Widespread drought is still being seen across US growing areas, with an area representing roughly 97% of US cotton under drought as of May 19, but some areas are starting to received timely rains, and this seemed to change the market’s psychology.

CRUDE OIL
- The crude oil market has been buffeted by the variable and sometimes conflicting announcements about prospects of an agreement between the US and Iran to end the war and reopen the Strait of Hormuz. At issue are the US demands that Iran end its uranium enrichment, allow inspections and/or the removal of said uranium, end its missile program, and end its support of proxies like Hezbollah and Hamas. Iran for its part would like to see economic sanctions lifted, particularly its oil industry. It has and has resisted some or all of the US requests. Both sides appear far apart. Occasional reports that a deal has been made sends crude oil prices lower, but then the market recovers when the promised agreement isn’t delivered.
- As recently as May 18, July Crude Oil reached a new contract high on reports of a drone attack on a USA nuclear power plant, but it subsequently fell back on another announcement that an agreement was close.

NATURAL GAS
- July Natural Gas traded to its highest level since the end of March on ideas that the chronic oversupply in the US had started to ease due to a slowdown in production in the US and a heat wave that presented the possibility that the rate of gain in US storage could slow down. However, the market failed to hold its gains after the forecast moderated.
- At one point the 6-10 and 8-14 day maps showed above normal temperatures across most of the US lower 48, but they have since change to a mix of above and below normal. It is likely too early in the season to see and extended heat wave or “heat dome” that would keep cooling demand elevated for an extended period.
LIVE CATTLE
- Cattle prices and beef prices continue to move higher due to the lowest cattle inventory since 1951.
- For the week ending May 15, year to date US federal cattle slaughter was down more than 1 million head from year ago.
- Beef production for the year was down 7.1%.
- As of May 15, cash cattle prices had moved to record highs, with live cattle prices reaching $265.50/cwt and dressed prices $415.00.
LEAN HOGS
- Year to date pork production has been increasing throughout 2026, with increasing hog inventory and heavier hogs.
- US federal hog slaughter in January was down 4.1% compared from January 2025, but by May 15, 2026 year to date slaughter was down just 0.7%.
- Hog weights have been increasing this year, averaging 293 pounds as of May 15, up 3 pounds from a year prior.
- Although 2026 US slaughter is lower, increasing hog weights have allowed US pork production to increase 1%.
STOCK INDEX FUTURES
- Stock index futures staged a powerful advance the past month, driven by one of the strongest earnings seasons in recent memory, with record highs seen in the S&P 500, the Nasdaq Composite, and the Dow.
- The primary driver of the rally was a historic Q1 2026 earnings season. With 91% of S&P 500 companies having reported as of mid-May, 84% beat EPS estimates, the highest proportion since the second quarter 2021. The blended earnings growth rate for Q1 reached 27.1% year-over-year, the index’s best showing since Q4 2021 and the sixth consecutive quarter of double-digit earnings expansion. Revenue growth was 11.1% YoY, the strongest since Q3 2022, with companies reporting earnings 20.7% above consensus estimates on average. The IT sector was the standout, with earnings growth approaching 46%, as AI-related capital expenditure narratives translated into tangible bottom-line beats.

CURRENCIES
- The US Dollar Index has regained its title as a global safe-haven amid the US-Iran conflict after that identity had fractured in April last year. It has found strong demand during periods of increased hostilities and declines when tensions ease. It is also finding support from favorable interest rate differentials and a repricing of Fed policy expectations.
- The euro drifted lower through the end of April, recovered a bit in early May as risk appetite improved on earnings euphoria and optimism that a deal between the US and Iran could be reached but then weakened as US-Iran talks remained in deadlock.
INTEREST RATES
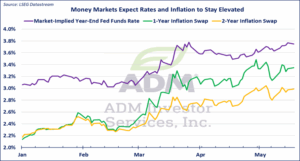
- The Treasury markets have experienced significant volatility since mid-April, mainly driven by sharply higher inflation and a repricing of Fed rate expectations. The 10-year yield has risen 35 bps since April 16, while the 30-year yield now sits close to 5.2%, as bond markets grow uncomfortable with the ongoing closure of the Strait of Hormuz and growing fiscal deficits.
- Inflationary conditions are structurally bearish for bonds, especially as expectations of a rate hike policy grow absent any developments in the Persian Gulf. The 2-year yield is above the Fed Funds rate, and in recent history when that happened, it signaled the next move from the Fed (and vice-versa). Now, with the 2-year yield more than 25 bps above the upper-bound of the FF rate and surging inflation for both consumers and producers, bond markets are suggesting that the next move may be a hike.
GOLD & SILVER
- Gold prices have continued to trend downwards since mid-April, as the market navigates a challenging macroeconomic environment in which higher Treasury yields, a stronger dollar, and a hawkish repricing of Fed rate expectations have weighed on prices.
The core challenge for gold during is the same dynamic that pressured prices in March, but it has intensified. With April CPI reaching 3.8% YoY and core CPI at 2.8%, headline inflation is running nearly double the Fed’s 2% target, which would normally be constructive for gold as an inflation hedge.
COPPER
- COMEX copper futures (HG) rallied strongly since mid-April, advancing from $6.08 to a $6.64 before settling near $6.30 as of May 20. The move featured a sharp rally in early to-mid May on the back of supply worries, following an announcement that Freeport McMoran’s Grasberg mine in Indonesia, the world’s second largest, would face further production delays. On the LME, the move was even more dramatic: 3-month copper broke above $14,000 per metric ton for the first time since January’s prior peak, touching $14,021 on May 12 and inching toward a fresh all-time high before pulling back to around $13,450 as of May 20.
Interested in more futures market commentary? Explore our Market Dashboards here.
Risk Warning: Investments in Equities, Contracts for Difference (CFDs) in any instrument, Futures, Options, Derivatives and Foreign Exchange can fluctuate in value. Investors should therefore be aware that they may not realise the initial amount invested and may incur additional liabilities. These investments may be subject to above average financial risk of loss. Investors should consider their financial circumstances, investment experience and if it is appropriate to invest. If necessary, seek independent financial advice.
ADM Investor Services International Limited, registered in England No. 2547805, is authorised and regulated by the Financial Conduct Authority [FRN 148474] and is a member of the London Stock Exchange. Registered office: 3rd Floor, The Minster Building, 21 Mincing Lane, London EC3R 7AG.
A subsidiary of Archer Daniels Midland Company.
© 2021 ADM Investor Services International Limited.
Futures and options trading involve significant risk of loss and may not be suitable for everyone. Therefore, carefully consider whether such trading is suitable for you in light of your financial condition. The information and comments contained herein is provided by ADMIS and in no way should be construed to be information provided by ADM. The author of this report did not have a financial interest in any of the contracts discussed in this report at the time the report was prepared. The information provided is designed to assist in your analysis and evaluation of the futures and options markets. However, any decisions you may make to buy, sell or hold a futures or options position on such research are entirely your own and not in any way deemed to be endorsed by or attributed to ADMIS. Copyright ADM Investor Services, Inc.
Latest News & Market Commentary
ADM & Industry News
Wkly Futures Market Summary For 5.26.2026
May 26, 2026
Equities Higher on Hormuz Reopening Hopes
May 26, 2026