USDA March WASDE saw no change to the US 2025/26 balance sheet with ending stocks holding at 2.127 billion bushels, a seven-year high. The stocks/use ratio at 12.9% was a six-year high.
Global stocks rose 1.3% to 293 million metric tons.
South American production was unchanged, with a million-ton increase in Brazil offset by likewise cut in Argentina
Brazil’s first-crop harvest has reached 50% complete versus 72% a year ago, while second-crop plantings have reached 91% versus 97% a year ago.
Ukraine production was raised by 1.7 million tons to 30.7 million
The USDA Outlook Forum forecasts for US 2026 planted area was 94 million acres, down 4.8 million from 2025. Production was forecast at 15.755 billion bushels, down 7.4% from 2025.
SOYBEANS
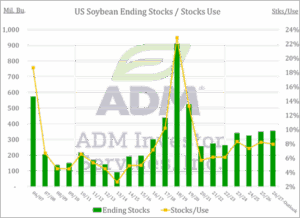
USDA March WASDE saw US ending stocks hold at a six-year high at 350 million bushels for 2025/26.
Crush was increased by 5 million bushels, but that was offset by 5 million-bushel increase in imports.
Without additional Chinese buying, US exports at 1.575 billion bushels appears high. US soybeans are trading $1+ above Brazil.
The crush pace supports another 10-20 million-bushel increase I the current USDA estimate of 2.575 billion bushels.
Bean oil usage for biofuel production was cut 800 million pounds to 14.0 billion, while domestic use was up 750 million pounds.
Global stocks were held steady at 125.3 million metric tons.
Brazilian production was unchanged at a record 180 million tons, while Argentina was cut by 0.5 million tons to 48 million.
WHEAT
USDA March WASDE held 2025/26 stocks were steady at 931 million bushels, a six-year high.
There were no changes to demand or for the various classes.
Global stocks were down 0.5 million metric tons to 277 million.
Argentine exports were up 1.5 million tons, while Australian production was down 1 million tons to 36 million metric tons.
Russian and Ukraine exports were cut 0.5 million tons, and EU was down 1 million.
2026 US winter wheat planted areas was 33 million acres, down 0.5% from 2025.
COCOA
Ivory Coast and Ghana lowered their official farmgate prices, after the prices set early in the 2025/26 season proved to be too high for the market.
Prior to the price cuts, there were reports that newly harvested cocoa was not getting sold and was at risk of rotting.
As of March 1, Ivory Coast set fixed farmgate price paid to cocoa farmers for the midcrop at 1,200 CFA francs per kilogram ($2,140 per metric ton), down 57% from the main crop price of 2,800 CFA francs per kg ($4,190/ton) that took effect in October.
Ivory Coast also moved the official start date of the mid-crop to March 1 from the usual April 1.
COFFEE
May Coffee found support at the consolidation area from July.
Brazil’s 2026/27 production forecasts running around 71-75 million bags versus 63-64 million in 2024/25.
This is the “on-year” in the biennial cycle for Brazil’s arabica crop, and the key growing region has seen good rainfall this season after a dry start last fall.
Forecasts over the past month for arabica production have ranged from 46 to 49 million bags for arabica (median 47.8 million) versus a median of 35.8 million for 2025.
Brazilian green coffee exports in February fell to 2.29 million bags, down 26.9% from a year earlier.
SUGAR
The energy market rally (especially gasoline) suggests Brazilian crushers may focus more on ethanol production in the upcoming marketing year, which begins officially on April 1. As of February 1, Brazilian Center South sugar’s cane crushing for the 2025/26 marketing year was 50.74% versus 49.26% for that point in 2024/25. A number of local industry lobbies said on Monday that Brazil’s ethanol production is forecast to rise by some 4 billion liters in the 2026/27 season from a year earlier, which would be a new record.
El Nino is a potential threat to production in 2026/27. World Weather Inc. commented that recent forecasts by NOAA and the Australian Bureau of Meteorology may be have been too aggressive, but they did say confidence was high that an event will evolve later this year. This could will change weather in Southeast Asia late in the second quarter or early in the third quarter toward drier than usual conditions. India’s monsoon may start off favorably but could end up in a drier mode as well.
COTTON
May Cotton recently broke above the neckline of what appeared to be a head and shoulders bottom technical formation, and that sparked a short covering rally to levels not seen since last September.
The fund position has been near a record net short level for some time, and this left the market vulnerable to aggressive buying. The recent Commitments of Traders Report showed managed money traders were net buyers of 6,182 contracts of cotton futures for the week ending March 10, reducing their net short to 66,754, but that was still historically large.
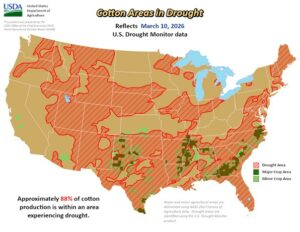
Drought conditions across most of the US cotton belt raise concerns about US crop prospects in 2026. The recent US drought monitor showed an area representing 88% of US cotton production was experiencing drought, up from 33% a year ago.
CRUDE OIL
The US-Israel attacks on Iran have been THE factor dominating the market since they began on Saturday, February 28. Crude oil gapped higher on Monday, March 2 and worked steadily higher through the week, but prices really took off the following Monday when Iran effectively stopped shipping traffic through the Strait of Hormuz.
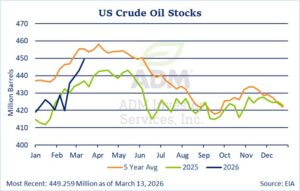
This “worst case” scenario that stopped the movement of roughly 20% of global oil supply sent nearby crude prices to their highest level since June 2022, when the market was reacting to Russia’s invasion of Ukraine and the subsequent attempts on the part of the US and EU to sanction Russian oil shipments. US WTI prices have since backed off from their March 9 highs but Brent prices have not, as that market is more responsive to actions in the Gulf. Middle East benchmark Dubai and Oman premiums recently hit all-time highs if $65 per barrel. US crude oil stocks have increased.
Saudi Arabia is sending about 5 million barrels per day to a the port of Yanbu on the Red Sea, but Iran has lobbed missiles the. A UAE port outside the Strait has also come under attack from Iran. Iran has taken an aggressive approach against other Gulf producers that is undermining their support in the region and which appears to have caught the Trump Administration off guard.
NATURAL GAS
May Natural Gas rallied in the wake of the closing of the Strait of Hormuz but has not held those gains.
The largest liquified natural gas facility is located in the Persian Gulf, and the Strait’s closing is believed to have cut off roughly 20% of global supply, and the plant has been forced to suspend production. A subsequent attack on the facility by Iran has damaged an estimated 17% of the plant’s capacity, which the owner, QatarEnergy, estimates could take 3-5 years to repair
London gas prices soared on Thursday in reaction to the strike, but US prices only saw mild support because the US is self-sufficient on gas supply and its LNG exports are already near maximum capability.
LIVE CATTLE
The USDA projects 2026 beef production at 25.810 billion pounds, down 110 million pounds from the February update, due to steep decline in first-quarter slaughter.
As of March 14, year-to-date federal slaughter was down 606,349 head from year ago, a decline of 9.9%.
The amount of cattle being kept on feed for more than 150 days is up 22% so far this year, as negative packer margins have feedlots keeping cattle longer.
Regarding the strike at JBS Greeley, Colorado, JBS claims cattle destined for Greeley facility will be moved to other plants and that JBS will cover the transportation cost.
The war in Iran is causing gas and diesel prices to rise.
LEAN HOGS
As of March 14, 2026 year to date federal hog slaughter was down 1.4% off 361,204 head.
However for 3 weeks , February 21, 2026 through March 14, 2026, hog slaughter increased by 1.4% with live weights averaging 292 pounds, the same as 2025.
High beef prices are expected to have U.S. consumers to increase pork consumption in 2026. The USDA WASDE Report projects 2026 pork consumption at 50.5 pounds up from 2025 at 49.3 pounds. Private analyst project consumption to increase from 2 pounds to 4 pounds.
STOCK INDEX FUTURES
The S&P 500 futures fell 1.7% since mid-February, trading in a wide range between 6,608.50 and 6,925.75, with a sharp selloff occurring as Iran escalated its disruption of the Strait of Hormuz. The market had been range-bound between roughly 6,800 and 7,000 since December, before the geopolitical shock broke it lower.
Nasdaq 100 futures outperformed, gaining 1.0% since mid-February and the only index to finish in positive territory. Mega-cap tech names benefited from their perceived quality and earnings resilience, attracting dip-buyers.
The Dow futures were the worst-performing index, declining 4.6% (-2,257 points) since mid-February. The heavier weighting toward industrials, energy-sensitive names, and value stocks made the Dow particularly vulnerable to the oil-shock selloff. The Index dropped from above 49,600 to a low of 46,392, recovering to 47,355 by mid-March.
CURRENCIES
The US Dollar Index is firm, supported by US yields grinding higher and markets fading aggressive Fed rate-cut scenarios. The Index has been climbing in March, supported by safe-haven flows, as investors favor cash over allocations in equities, Treasuries, and precious metals. The spot Index was up 2.47% to 99.56 from February 17 to March 17.
EUR/USD declined 3.4% since mid-February, falling from $1.19 to $1.15. The pair experienced sustained selling pressure after failing to consolidate above 1.22 earlier in 2026. The dollar strengthened broadly on safe-haven demand amid the Iran conflict, while the euro weakened on concerns that Europe’s energy-dependent economies face disproportionate risk from surging oil prices. A bearish head and shoulders pattern formed on shorter timeframes, completing below the 1.16 level.
INTEREST RATES
Yields rose sharply across the curve between mid-February and mid-March, with 2-Year Notes climbing 27 bps to 3.70% and 10-Year Notes rising 20 bps to 4.22%. Yields jumped in the second week of March as oil-shock inflation fears intensified. The 10-year yield reached its highest level since early January, driven by concerns that oil prices above $100 per barrel would push PCE inflation from 2.9% to 3.5% by summer. The yield curve has flattened in response, with the 2/10 year spread narrowing as longer-dated bonds reflected inflation risk, while shorter-dated bonds have risen sharply on fading Fed easing expectations.
Price declines have been generally concentrated around geopolitical events, overshadowing key data and Fed‑speak days. However, bonds were pressured from upside inflation surprises and hawkish commentary.
GOLD & SILVER
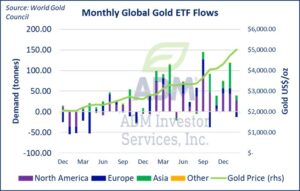
Upside risks to inflation as a result of the conflict in Iran have led investors to scale back expectations that the Fed and other major central banks would ease rates.
The US Dollar Index has advanced over 2% over the past month, weighing on gold prices, while investors have shifted portfolio allocations toward cash instead of traditional safe havens.
COPPER
May COMEX copper gained 2.5%, from $5.63 to $5.77, between mid-February and mid-March, touching a local high of $6.08 on March 1. The all-time high of $6.58 was set in January. Meanwhile, LME copper cash settlement rose from $12,561 per metric ton to $12,760 (+1.6%).
A divergent story has emerged in physical markets: LME warehouse stocks have surged 41% from 221,625 metric tons to 311,600 over the past month, the highest level since mid-2024, signaling accumulating surplus conditions outside the U.S.
The US Supreme Court’s ruling against the Trump tariffs was initially perceived as trade-friendly and as boosting demand expectations. However, gains were tempered by rising inventory levels and slowing Chinese consumption.
Interested in more futures market commentary? Explore our Market Dashboards here.
Risk Warning: Investments in Equities, Contracts for Difference (CFDs) in any instrument, Futures, Options, Derivatives and Foreign Exchange can fluctuate in value. Investors should therefore be aware that they may not realise the initial amount invested and may incur additional liabilities. These investments may be subject to above average financial risk of loss. Investors should consider their financial circumstances, investment experience and if it is appropriate to invest. If necessary, seek independent financial advice.
ADM Investor Services International Limited, registered in England No. 2547805, is authorised and regulated by the Financial Conduct Authority [FRN 148474] and is a member of the London Stock Exchange. Registered office: 3rd Floor, The Minster Building, 21 Mincing Lane, London EC3R 7AG.
Futures and options trading involve significant risk of loss and may not be suitable for everyone. Therefore, carefully consider whether such trading is suitable for you in light of your financial condition. The information and comments contained herein is provided by ADMIS and in no way should be construed to be information provided by ADM. The author of this report did not have a financial interest in any of the contracts discussed in this report at the time the report was prepared. The information provided is designed to assist in your analysis and evaluation of the futures and options markets. However, any decisions you may make to buy, sell or hold a futures or options position on such research are entirely your own and not in any way deemed to be endorsed by or attributed to ADMIS. Copyright ADM Investor Services, Inc.