Written Commentary

>>Read the complete June 2025 Edition HERE
Corn prices continue to shrug off tight US and global inventories as the market discounts higher production prospects from Brazil and a favorable weather outlook for the US crop. The market quickly moved on from this month’s WASDE report, which on the surface was mildly supportive. In the report, the USDA cut 2024/25 ending stocks by 50 million bushels on higher exports to 1.365 billion, 25 million below expectations. The old crop stocks/use at 8.9% is at a four-year low. China’s 2024/25 imports were cut 1 million metric tons to 7 million total. There were no changes to South American production forecasts.
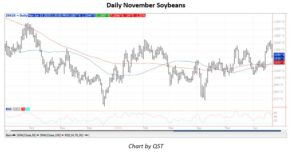
Volatility across the soybean complex spiked in mid-June, driven by larger than expected biomass-based diesel blending mandates (RVO’s) that resulted in a surge in soybean crushing margins. The EPA proposed green diesel blending rise to 5.61 billion gallons in 2026 and to 5.86 billion in 2027. Existing mandates cover only 3.35 billion. US biodiesel and renewable diesel capacity has been over 6.5 billion gallons annually for the past year. We are still awaiting clarity from the EPA on a small refinery waiver policy. Spot board crush margins have shot up about 40 cents from their recent low to $1.56 per bushel.
Wheat prices have been able to stage a modest recovery off the mid-June lows. The rebound was a result of speculative buying that was largely fueled by heavy rains across the southern US Plains and the Midwest, which slowed the winter wheat harvest. Money managers have been net buyers in wheat for the past four weeks, slashing their record net short position from just over 235,000 contracts to 183,000.
West Africa has received what has been described as “ample” rains over the past month, to the point where some growers in Ivory Coast were expressing concern that too much rain plus overcast skies recently week would cause some beans to be moldy. Ivory Coast port arrivals have been running behind year-ago levels for the past five weeks. Cumulative arrivals for the 2024/25 marketing year are still running ahead of year ago levels, but the gap is narrowing. In its second-quarter Bulletin of Cocoa Statistics, the International Cocoa Organization chose not to provide any update for 2024/25, saying they are reviewing the methodology it uses for forecasts and long-term projections.
The coffee market has been under pressure over the past month from the advancing robusta harvests in Brazil and Indonesia, which has eased tight supplies and pressured cash markets in Asia. The Brazilian arabica harvest is not as far along, but increasing robusta supplies have pressured arabica prices as well. Safras & Mercado said that Brazil’s 2025/26 coffee harvest reached 35% of the planted area as of June 11, short of 37% from a year earlier but ahead of the five-year average at 33%. The robusta harvest was 49% complete versus 51% a year prior and a five-year average of 50%. The arabica harvest was 26% complete versus 30% a year ago and 25% on average.
The June USDA Supply/Demand report put US 2025/26 cotton production at 14.00 million bales, down from 14.50 million in the May report. Harvested area was lowered to 8.19 million acres from 8.37 million in May, and yield was dropped to 820 pounds/acre from 832, both due to the heavy rains and delayed plantings in the Delta. Ending stocks came in at 4.30 million bales versus and down from 5.20 million in May. This put the stocks/use ratio at 30.8% versus 36.6% in May, 33.3% last year, and a five-year average of 27.2%. December cotton managed a slight rally in the sessions following the report but within a week it had fallen to its lowest level since April. US crop conditions as of June 15 had reaqched 48% good/excellent versus a five-year average of 47% for that week. Texas was 35% G/E versus a five-year average of 31%.
October Sugar has been in a steady downtrend over the past month, and nearby sugar has fallen to its lowest level since April 2021. A strong, early start to the Indian monsoon this year has boosted expectations for their 2025/26 crop and has increased the odds that nation will be a net exporter. Even prior to the monsoon’s arrival, the USDA and some private analysts were looking for a 22-26% increase in Indian production. The UNICA report showed Brazil’s Center South Cane crush for the second half of May was +5.5% from the same period last year and that sugar production was +8.9%.
The crude oil market worked gradually higher during the first part of June as negotiations between the US and Iran over their nuclear program failed and the prospects of some sort of sanctions relied for Iran faded. The June 13 attacks by Israel on Iran sparked a $7.99 rally in one day, taking the nearby contract to its highest level since January. The market remained volatile through the week, as Israel and Iran exchanged missile fire, including some energy infrastructure, and the trade began to wonder if the US would enter the conflict. That question was answered on Saturday June 21, when the US launched an attack on Iranian nuclear facilities, including the heavily fortified site at Fordo, which it hit with “bunker-buster” munitions. August Crude Oil opened sharply higher on Monday, but sold off through the session to close sharply lower on the day, creating a classic “key reversal” formation the on daily chart. A limited response by Iran to the bombing and a subsequent “cease-fire” announced by President Trump appeared to put a lid on the market, at least for the time being.
The Israel/Iran conflict reached the natural gas market when Iran partially suspended gas production at its South Pars field after an Israeli strike caused a fire there on the weekend of June 15-16. Iran shares the field with Qatar, which calls it the “North Dome.” The field is located offshore in southern Iran and is responsible for the most of the gas production there. Iran is the world’s third largest gas producer after the US and Russia. Qatar exports LNG through the Strait of Hormuz, and concerns that Iran may attempt to block the Strait lens support to natural gas prices.
Year-to-date US federal cattle slaughter at the end of May was down 6.2% from the same period in 2024 after being down 4.4% at the end of April. The negotiated average steer price moved from a record high at $218.83 on May 1 a new record of $229.62 by June 1. The choice beef cutout rallied from $343.17 to $366.34 during the month. Contributing to the shortage in the US cattle supply was the New World Screwworm Fly Parasite Quarantine on feeder cattle from Mexico.
Hog and pork prices have been moving steadily higher, in part it is due to the lighter slaughter in 2025 and in part due to rapidly rising beef prices. With beef and cattle prices at historic highs, hogs prices have benefited. At the same time, hog slaughter has declined. From January through May, US Federal hog slaughter was down 1,101,744 from the same period last year. During May, the CME Lean Hog Index moved from $89.57 to $94.13, and the CME Pork Cutout Index went from $97.12 to $102.58. US pork exports for 2025 have been down from last year.
Stock index futures have been characterized by a sentiment of cautious optimism – largely attributed to a lack of progress on US trade deals and uncertainty surrounding the impact of tariffs on the economy. The S&P 500 has posted a solid yet modest gain around +0.60% since between May 19 and June 18, bringing it close to 2% of all-time highs reached in February. Meanwhile, the Nasdaq has gained close to +2% while the Dow slipped -0.8%. Investor sentiment has been buoyed by better-than-expected inflation data, a labor market which has remained resilient, and a mix of corporate earnings and optimism in the tech sector.
The dollar has continued its decline against most major currencies, pressured by economic and policy uncertainty in the US and reflecting a shift in investor sentiment and macroeconomic expectations. From May 19 to June 18 the dollar fell roughly 1.5% against a basket of foreign currencies, touching lows of 97.60, last hit in March 2022. Additionally, recent data indicates that foreign central banks are reducing their dollar holdings, while large investment funds are gradually decreasing their exposure to US dollars and equities in favor of European and emerging markets and alternative assets.
The euro currency has experienced a steady appreciation against the US dollar, rising roughly 2.5% despite recent rate cuts from the European Central Bank. Improved business sentiment and a more stable inflation outlook contributed to increased investor confidence. The ECB cut its inflation forecasts to its target 2% this year, while the latest inflation reading posted a +1.9% annualized print. ECB Bank President Christine Lagarde has said that the bank is likely getting to the end of its monetary easing cycle but will remain vigilant in supporting the economy if needed. The outlook for growth in the eurozone remains in a state of uncertainty due to US tariff policy and the lack of a trade deal between the trading partners.
The British pound has experienced a modest growth against the US dollar, gaining roughly 0.8% over the dollar in the last 30 days. The Bank of England left its benchmark interest rate unchanged at its latest meeting, echoing a similar tone to the Federal Reserve’s decision. The BOE left its key rate at 4.25%, having cut in May while policymakers said they are likely to lower rates at a “careful and gradual” pace. The UK’s annualized rate of inflation fell to 3.4% in May from 3.5% in April, with rises in utility prices largely contributing to the jump in inflation.
The Treasury market has experienced a solid rally over the last month, with the ten-year yield falling around 20 basis points since May 20th. The two-year yield experienced a modest decline, while the 30-year yield also decline around 20 bps, reflecting a flattening of the yield curve. Investors have shown renewed demand for bonds after worries over a lack of demand for US debt subsided following several Treasury auctions for short and long dated debt that turned up solid demand. A slight uptick in jobless claims also supported bond prices over the last couple of weeks.
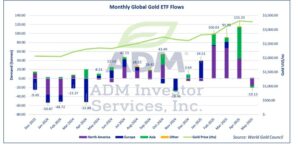
Gold prices have risen over 3% since late May, mainly due to rising geopolitical tensions in the Middle East that has spurred on safe-haven demand for the metal. Strong central bank purchasing of gold and a weaker dollar have also offer support for the metal. Central banks across the globe added a net 12 tons of gold to their reserves in April, and are on pace to purchase 1,000 metric tons of gold in 2025, marking the fourth consecutive year of substantial buying. They averaged a 400-500 metric-ton rate of accumulation in the previous decade, marking a substantial increase in investment.
The copper market has experienced moderate volatility, with prices rising to multi-month highs before pulling back slightly and the July contract up more than 4.5% since late May. The copper market has been betting that a US tariff will be imposed at a similar rate of both steel and aluminum, and this has caused copper to flow into the US from around the world ahead of the tariffs’ imposition. CME copper stocks continue to break record highs daily, while LME and Shanghai warehouses have seen mass outflows.
Interested in more futures market commentary? Explore our Market Dashboards here.