Written Commentary

SOYBEANS
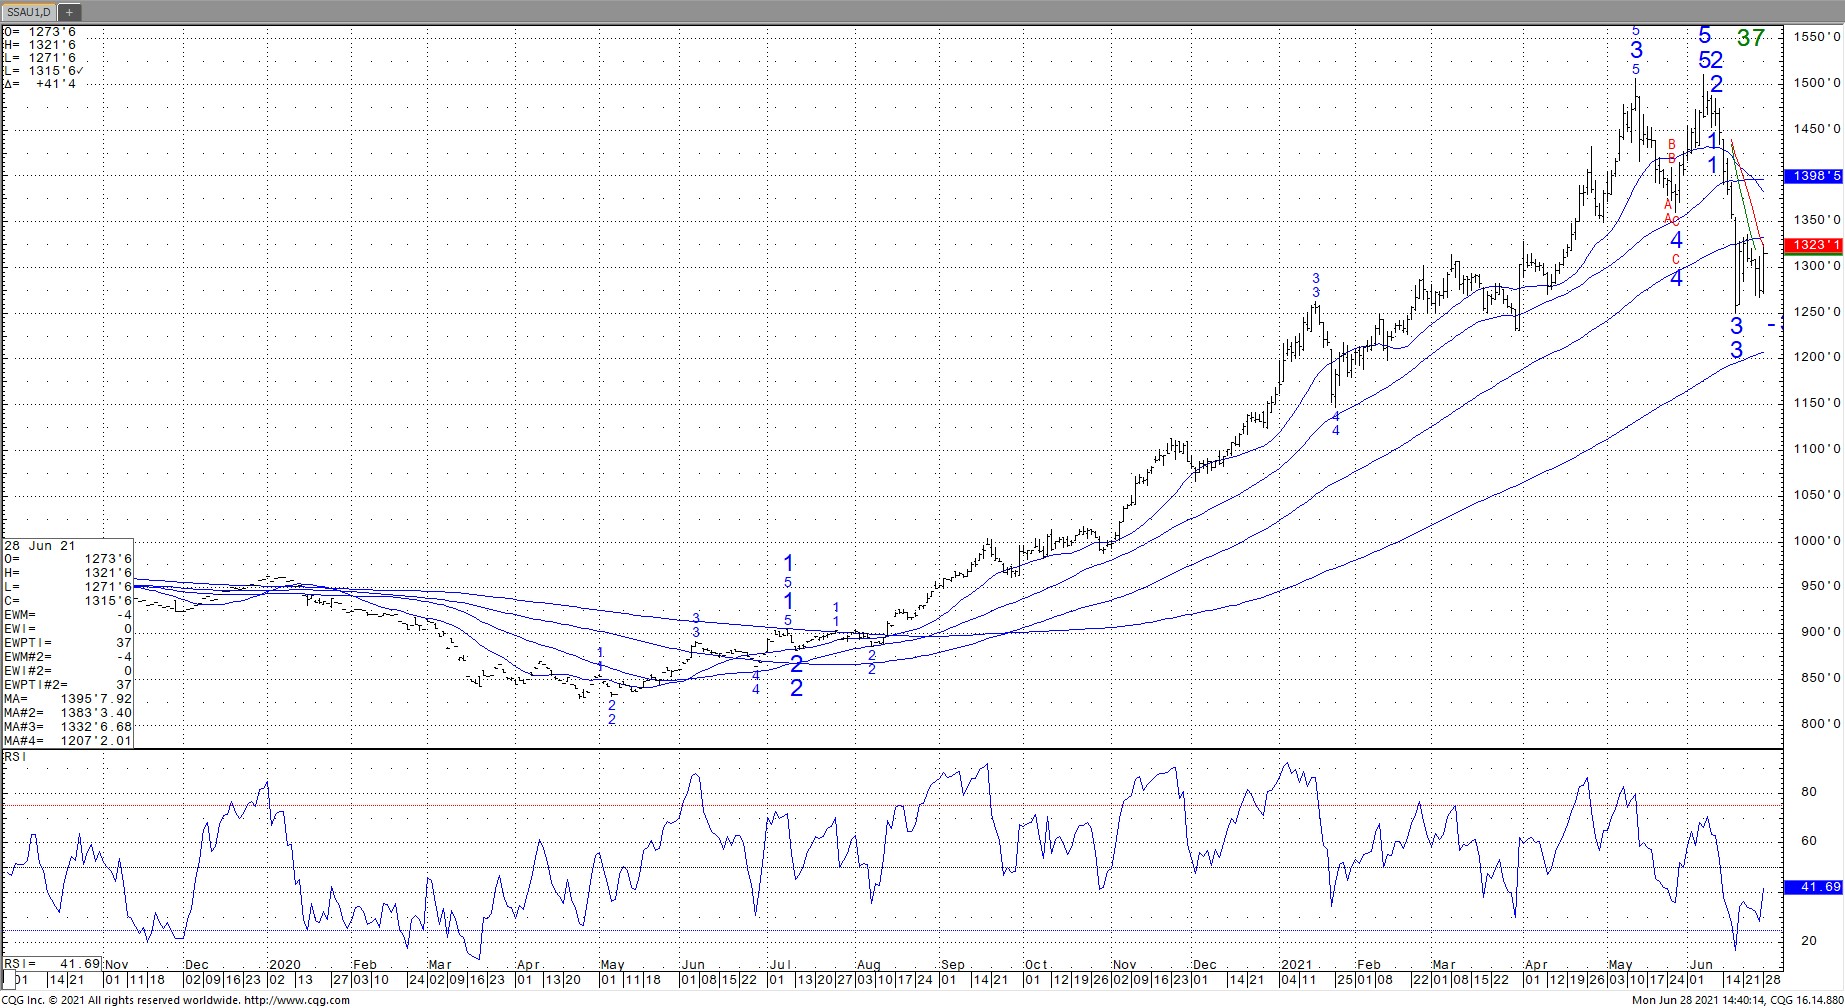
Soybeans traded back over Fridays high. Next resistance is near the 100 day average near 13.32. Since the high, soybean open interest dropped from 1,037,000 contract to Fridays low of 295,000. Sometimes, OI is a measure of bullishness. Slowdown in US exports and better weather triggered long liquidation. US central Midwest saw good weekend rains. Some feel USDA could increase weekly crop ratings to 61 pct G/E vs 60 last week. Weekly US soybean exports were near 4 mil bu vs 7 last week and 12 last year. Season to date exports are near 2,101 vs 1,353 ly. USDA goal is 2,280 vs 1,682 ly. Bulls feel final exports could be closer to 2,320. This would drop US 2020/21 carryout below 100 mil bu. USDA is also expected to estimate US 2012 soybean acres near 89.1 million vs 87.6 est in March. June 1 US soybean stocks are estimated near 773 mil bu vs 1,381 last year.
CQG Nearby September Soybean Futures Chart
CORN
Corn futures traded higher. CU traded back above the 100 day moving average. Morning GFS weather model suggesting warm and dry US Midwest 2 week weather triggered some new buying. Noon GFS was wetter. GFS model has trouble in transition weather. There was also talk that frost/freeze may have
reduced the Brazil corn crop even more than this years record drought. Since the high, corn open interest dropped from 1,966,000 contract to Fridays low of 1,263,000. Sometimes, OI is a measure of bullishness. Slowdown in US exports and better weather triggered long liquidation. US central Midwest
saw good weekend rains. Some feel USDA ould increase weekly crop ratings to 66 pct G/E vs 65 last week. Weekly US corn exports were near 40 mil bu vs 70 last week and 49 last year. Season to date exports are near 2,237 vs 1,313 last year. USDA goal is 2,850 vs 1,778 ly. Bulls feel final exports could be closer to 3,050. This would drop US 2020/21 carryout below 1,000 mil bu. USDA is expected to estimate US 2012 corn acres near 93.8 million vs 91.1 est in March. June 1 US corn stocks are estimated near 4,130 mil bu vs 5,003 last year.
Nearby September Corn Futures Chart
WHEAT
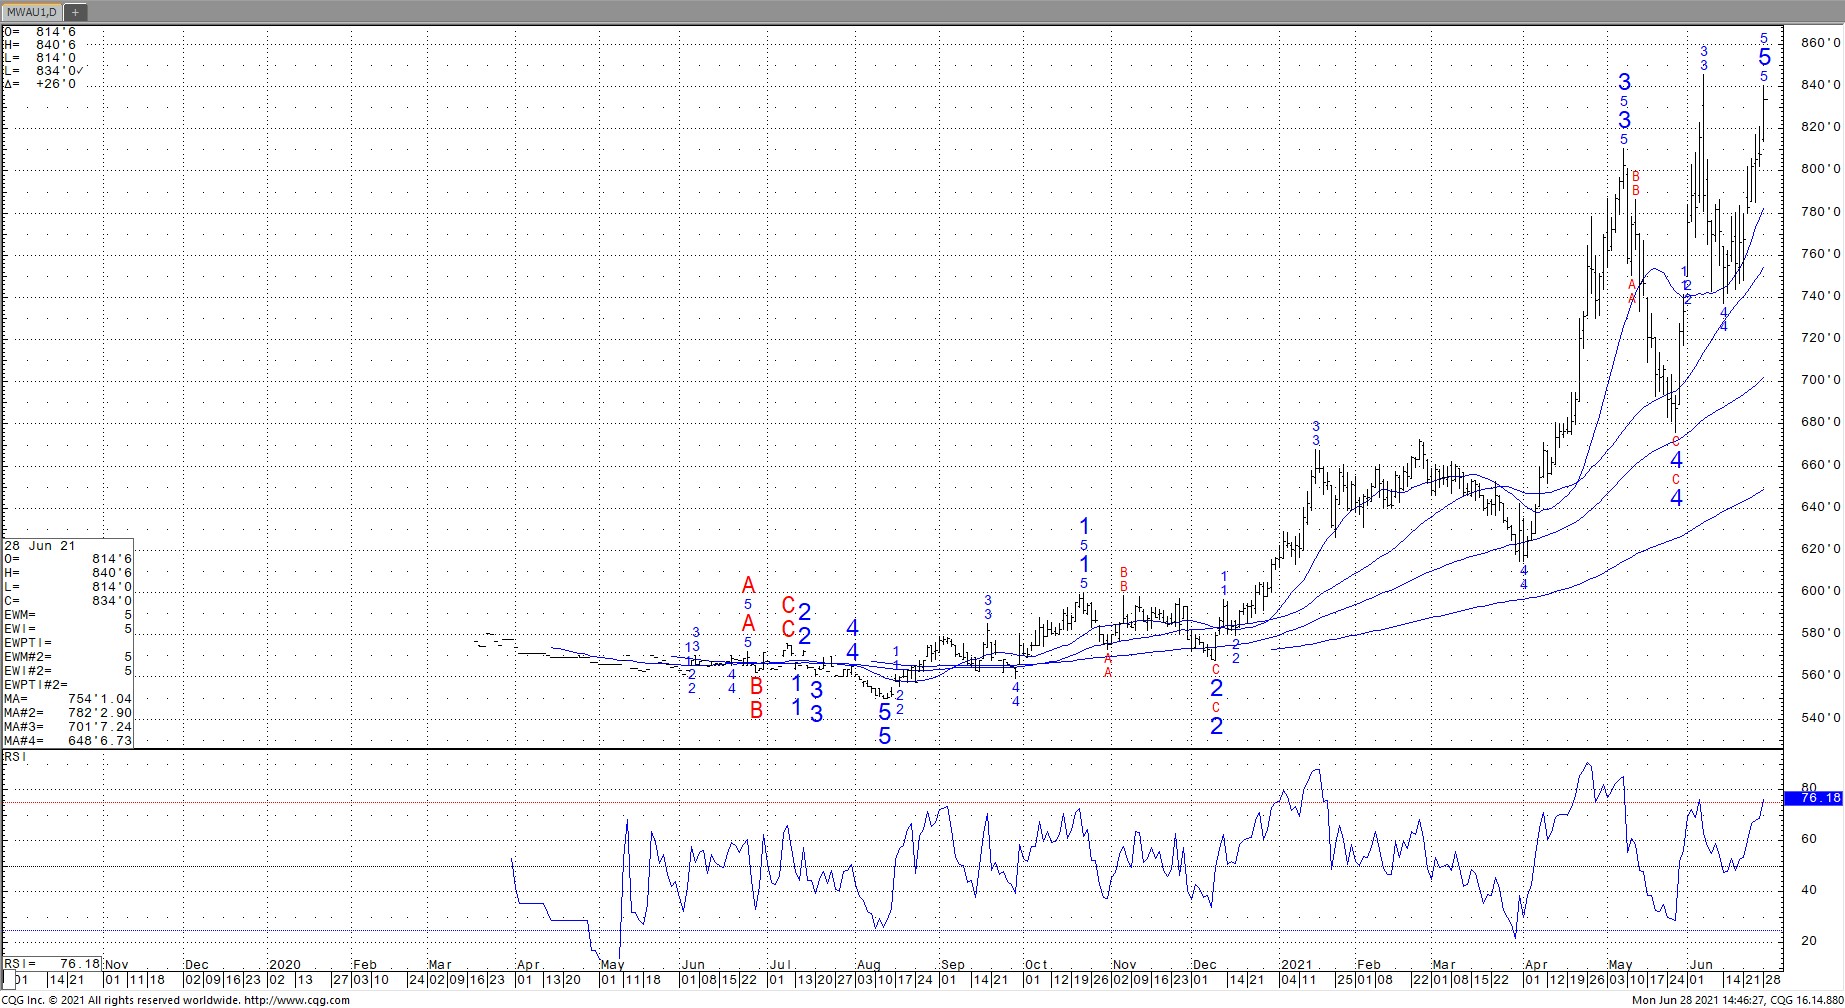
Wheat traded higher. Higher corn trade supported Chicago and KC wheat. Dry 2 week rain forecast for much of US north plains supported Minn wheat. Since the high, Chicago wheat open interest dropped from 526,000 contract to Fridays low of 360,000. KC OI from 342,000 to 127,000. Minn wheat OI remains historically high and near 77,000 contracts. Sometimes, OI is a measure of bullishness. Slowdown in US exports and better weather triggered long liquidation. Weekly US wheat exports were near 10 mil bu vs 20 last week and 19 last year. Season to date exports are near 56 vs 73 ly. USDA goal is 900 vs 985 ly. Bulls feel final US crop could be near 1,795 vs USDA 1,898. USDA is expected to estimate US 2012 wheat acres near 46.0 million vs 46.4 est in March. June 1 US wheat stocks are estimated near 861 mil bu vs 1,028 last year. Trade est US winter wheat harvest near 30 pct done vs 17 average. Trade also est US spring wheat crop rating near 25 pct G/E vs 27 last week. KC wheat farmer increase sales on todays rally.
Nearby Minneapolis Wheat Futures Chart
Risk Warning: Investments in Equities, Contracts for Difference (CFDs) in any instrument, Futures, Options, Derivatives and Foreign Exchange can fluctuate in value. Investors should therefore be aware that they may not realise the initial amount invested and may incur additional liabilities. These investments may be subject to above average financial risk of loss. Investors should consider their financial circumstances, investment experience and if it is appropriate to invest. If necessary, seek independent financial advice.
ADM Investor Services International Limited, registered in England No. 2547805, is authorised and regulated by the Financial Conduct Authority [FRN 148474] and is a member of the London Stock Exchange. Registered office: 3rd Floor, The Minster Building, 21 Mincing Lane, London EC3R 7AG.
A subsidiary of Archer Daniels Midland Company.
© 2021 ADM Investor Services International Limited.
Futures and options trading involve significant risk of loss and may not be suitable for everyone. Therefore, carefully consider whether such trading is suitable for you in light of your financial condition. The information and comments contained herein is provided by ADMIS and in no way should be construed to be information provided by ADM. The author of this report did not have a financial interest in any of the contracts discussed in this report at the time the report was prepared. The information provided is designed to assist in your analysis and evaluation of the futures and options markets. However, any decisions you may make to buy, sell or hold a futures or options position on such research are entirely your own and not in any way deemed to be endorsed by or attributed to ADMIS. Copyright ADM Investor Services, Inc.