Written Commentary

SOYBEANS
Soybean were mixed. SU is near 13.94. Range 13.88 to 14.01. SU testing 50 day moving average. Could test contract highs if next 2 weeks is hot and Dry across upper US Midwest. Higher Dalian soyoil and palmoil futures helped soyoil gain on soymeal. Malaysian palmoil futures were also higher. Some link this to higher global canola oil prices due to concern about lower Canada crop. Weekly US soybean export sales were only 800 thousand bushels. Total commit is near 2,275 mil bu vs 1,712 last year. USDA goal is 2,270 vs 1,679 last year. Brazil has loaded only 4.4 mmt of soybeans for export for July. Some feel they may be out of soybeans for export. Brazil farmer has slowed cash sales. NOPA US June soybean crush was only 152 mil bu vs 159 expected and 167 last year.

CORN
Corn futures traded lower. CU ended near 5.64. Range was 5.61 to 5.71. CU has traded back over the 100 day and 20 day moving average due to concern over US NW Midwest crop. Next 2 weeks could be hot and dry there. Big debate over final US corn yield. Most doubt US trend and record estimate of 179.5. Few even doubt if this years crop will equal the record of 176.6. Lower trade linked in part to IA/IL rains and slow US corn export sales pace. Weekly sales were only 5 mil bu. Total commit is near 2,750 mil bu vs 1,712 last year. USDA goal is 2,850 vs 1,777 last year. There is talk that Brazil export prices are above US. There is also talk that Brazil bought 20 Argentina corn cargoes yesterday. Argentina Parana river is lowest in 80 years. All of this suggest that Brazil and Argentina may not be able to export 27 mmt that USDA is forecast July-Sep. Some feel exports may drop 10 mmt or 400 mil bu. Some or all of this could shift to US. US farmer selling has slowed as they await July weather. US June 1 corn stocks were 4,112 mil bu vs 5,003 last year. July-Sep feed use is est near 670 vs 973 ly, exports 652 vs 548 last year and FSI 1,734 vs 1,582 ly. These leaves end stocks near 1,082 vs 1,919 last year.
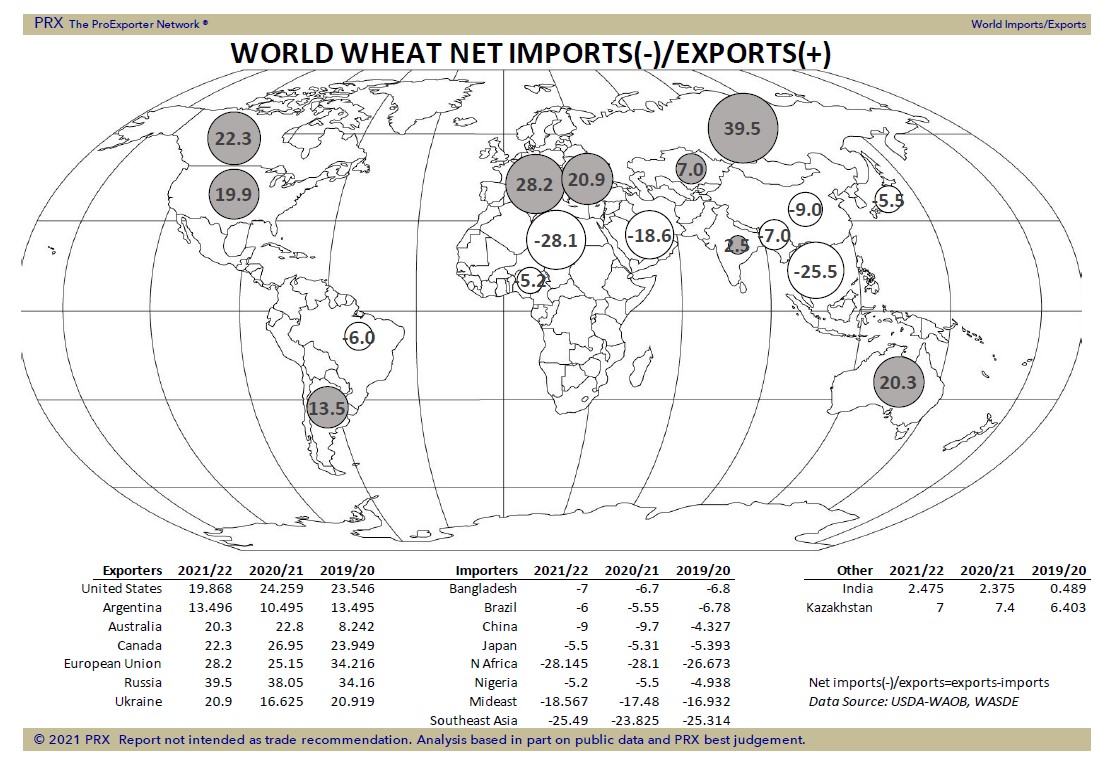
WHEAT
Wheat futures ended higher. WU ended near 6.72. Range 6.51 to 6.73. KWU ended near 6.39. Range was 6.23 to 6.41. MWU made new highs near 8.94. Range 8.73 to 8.95. WU has now traded over the 200 day, 20 day and 100 day moving averages. 6.76 is the 50 day. Buying due to talk that exporters that sold German and Baltic wheat for export are having problem sourcing wheat due to late harvest. There is also concern that EU wheat quality is dropping due to rains. EU cash wheat prices are also increasing. Talk of lower Russia spring wheat yields due to dry weather is also supportive. Weekly US wheat export sales were near 15 mil bu. Total commit is near 70 mil bu vs 104 last year. USDA dropped their export goal to 875 vs 992 last year.
Risk Warning: Investments in Equities, Contracts for Difference (CFDs) in any instrument, Futures, Options, Derivatives and Foreign Exchange can fluctuate in value. Investors should therefore be aware that they may not realise the initial amount invested and may incur additional liabilities. These investments may be subject to above average financial risk of loss. Investors should consider their financial circumstances, investment experience and if it is appropriate to invest. If necessary, seek independent financial advice.
ADM Investor Services International Limited, registered in England No. 2547805, is authorised and regulated by the Financial Conduct Authority [FRN 148474] and is a member of the London Stock Exchange. Registered office: 3rd Floor, The Minster Building, 21 Mincing Lane, London EC3R 7AG.
A subsidiary of Archer Daniels Midland Company.
© 2021 ADM Investor Services International Limited.
Futures and options trading involve significant risk of loss and may not be suitable for everyone. Therefore, carefully consider whether such trading is suitable for you in light of your financial condition. The information and comments contained herein is provided by ADMIS and in no way should be construed to be information provided by ADM. The author of this report did not have a financial interest in any of the contracts discussed in this report at the time the report was prepared. The information provided is designed to assist in your analysis and evaluation of the futures and options markets. However, any decisions you may make to buy, sell or hold a futures or options position on such research are entirely your own and not in any way deemed to be endorsed by or attributed to ADMIS. Copyright ADM Investor Services, Inc.