Written Commentary

Following Friday’s disappointing close, prices have surged to $.06 – $.10 gains today led by old crop. July-24 experienced an outside day up with next resistance at $4.71. Longer term resistance at $5.03, 38% retracement from June-23 high to Feb-24 low. Dec-24 has surged to a 4 month high. Last week money managers were net buyers of 20,500 contracts, reducing their net short position to 218k contracts. A number of rain events are expected across the central and ECB this week slowing planting progress. Heaviest rains expected for the SE corn belt with best planting opportunities in the far WCB. Export inspections at 51 mil. bu. were in line with expectations and well above the 39 mil. bu. needed per week to reach the USDA export forecast of 2.10 bil. YTD inspections at 1.298 bil. are up 33% from YA, vs. the USDA forecast of up 26%. Since July-23 Ukraine’s grain exports have reached 42 mmt, just below the 42.6 mmt YA. Their corn shipments have reached 23.3 mmt vs. the USDA forecast of 24.5 mmt for the 23/24 MY.

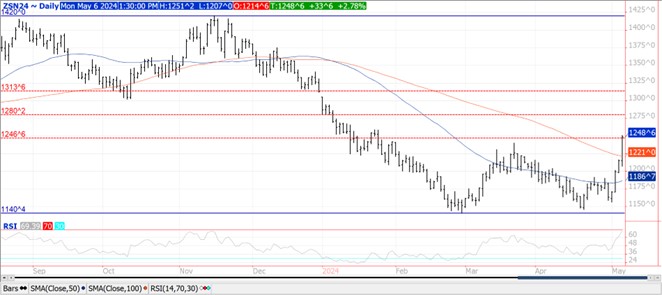
Prices surged across the complex with beans $.20 – $.33 higher, meal was up $9 – $15, while oil was 60 – 75 higher. July beans have surged to their highest level since late Jan-24 having reached a 38% Fibonacci retracement level. Next resistance is at $12.58 ½. Fresh 4 month high for Nov-24 beans. July-24 meal surged to its highest level since late Dec-23 trading thru its 50% retracement at $380. Despite today’s rebound, July-24 oil remains within its range from last Tues. when prices collapsed to fresh lows. Flooding rains and potential crop losses in Southern Brazil continue to fuel the production uncertainty and speculative buying. The death toll from the massive rain event has reached 83 with 111 missing and over 122,000 displaced. While a dryer trend has started to evolve in RGDS after 1 – 2 feet of rainfall over the last 10 days, it will likely be a few weeks before crop damage can be fully assessed. RGDS production was projected to reach 22 mmt. With an estimated 5.5 mmt remaining in waterlogged fields, best guess on production losses is between 1.5 – 3 mmt. Are these production losses coming off of Conab’s 146.5 mmt forecast, or the USDA’s at 155 mmt. YTD inspections at 1.437 bil. are down 18% from YA, vs. USDA forecast of down 15%. MM’s were buyers of nearly 24k contracts of meal, sellers of just over 17k oil while mostly flat in soybeans. The MM short position in bean oil at nearly 67k contracts is the largest since May-2019. Significant buying in soybean since last Tues. has likely cut much deeper into MM’s reported short position of 149k.
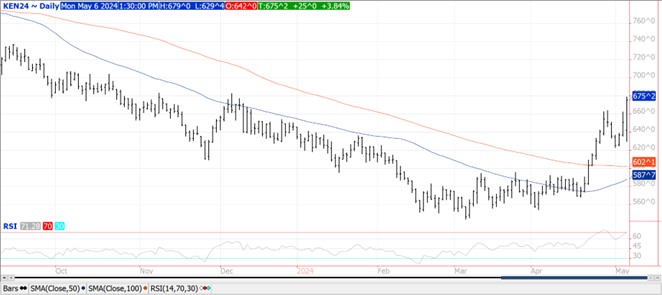
Prices were higher across all 3 classes today, with Chicago and KC up $.23 – $.26 while MGEX was $.11 – $.12 higher. Chicago July-24 surged to its level since late Dec-23. Next resistance is the Dec. high at $6.66. Same story with July-24 KC with next resistance at Dec-23 high at $6.82 ¾. A hard freeze in Eastern Ukraine and SW Russian growing regions late this week may threaten developing crops. Some rains did fill in over dryer areas of the SW plains over the weekend, however by no means a drought buster. IKAR is reporting the Russian wheat export price rose $4 LW to $216/mt. SovEcon reports Russian shipments at 770k mt LW, down from 990k mt the previous week. Export inspections at 13 mil. bu. were in line with expectations. YTD inspections at 634 mil. are down 6.5% from YA, in line with the USDA. MM’s were huge buyers of wheat last week with just over 28k Chicago, 18.6k KC and 15.3k in MGEX. Their combined short position across all 3 classes is down to 87k contracts, the smallest since Sept-2023.
Risk Warning: Investments in Equities, Contracts for Difference (CFDs) in any instrument, Futures, Options, Derivatives and Foreign Exchange can fluctuate in value. Investors should therefore be aware that they may not realise the initial amount invested and may incur additional liabilities. These investments may be subject to above average financial risk of loss. Investors should consider their financial circumstances, investment experience and if it is appropriate to invest. If necessary, seek independent financial advice.
ADM Investor Services International Limited, registered in England No. 2547805, is authorised and regulated by the Financial Conduct Authority [FRN 148474] and is a member of the London Stock Exchange. Registered office: 3rd Floor, The Minster Building, 21 Mincing Lane, London EC3R 7AG.
A subsidiary of Archer Daniels Midland Company.
© 2021 ADM Investor Services International Limited.
Futures and options trading involve significant risk of loss and may not be suitable for everyone. Therefore, carefully consider whether such trading is suitable for you in light of your financial condition. The information and comments contained herein is provided by ADMIS and in no way should be construed to be information provided by ADM. The author of this report did not have a financial interest in any of the contracts discussed in this report at the time the report was prepared. The information provided is designed to assist in your analysis and evaluation of the futures and options markets. However, any decisions you may make to buy, sell or hold a futures or options position on such research are entirely your own and not in any way deemed to be endorsed by or attributed to ADMIS. Copyright ADM Investor Services, Inc.